Case study · Data Visualisation
Road analytics, from months to hours
An integrated platform for route planning, in-vehicle data capture, and insight dashboards. Route planning dropped from up to a week to as little as six hours, and field-to-client data delivery from up to three months to as little as 48 hours.
The client
NTRO gathers comprehensive transport data (road network conditions, potential pothole locations, and areas prone to failure) using specialised survey vehicles. That data becomes actionable insight for road maintenance and safety improvements.
Challenge
Collecting road network data is complex. From request to route planning to report building, everything was manual, taking anywhere from 6 weeks to 6 months depending on the network’s size and complexity.
- Fragmented workflows: route planning, data capture, and reporting lived in disconnected tools, breeding inefficiency and errors.
- Driver experience: drivers and navigators lacked a streamlined system to follow routes and collect accurate data in real time.
- Data accessibility: internal teams and customers struggled to access and interpret survey data; insights lacked clarity and were hard to act on.
Research & discovery
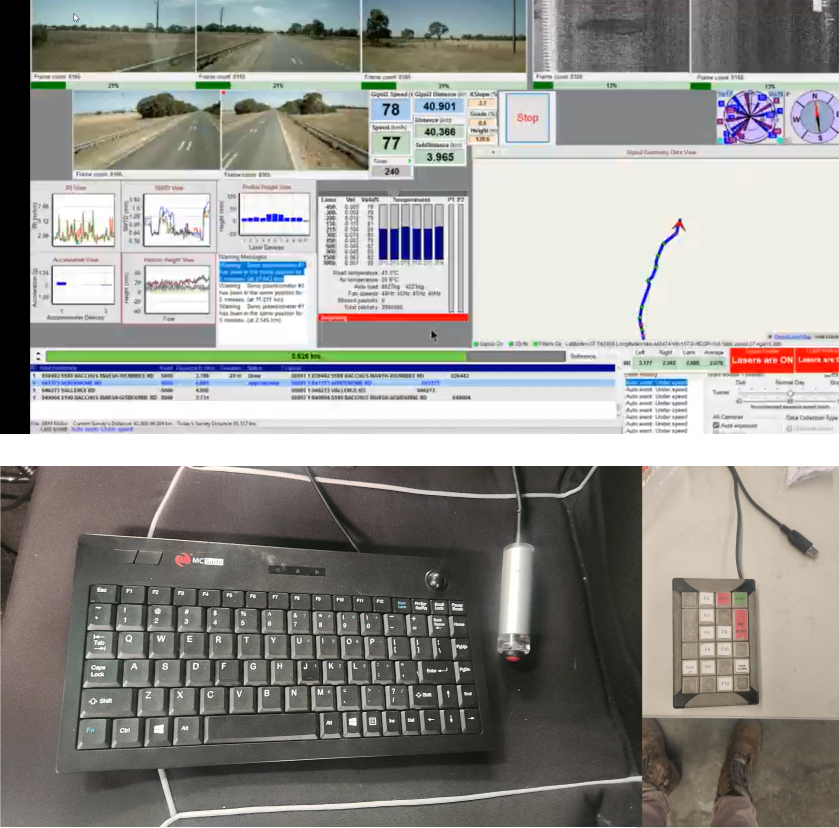
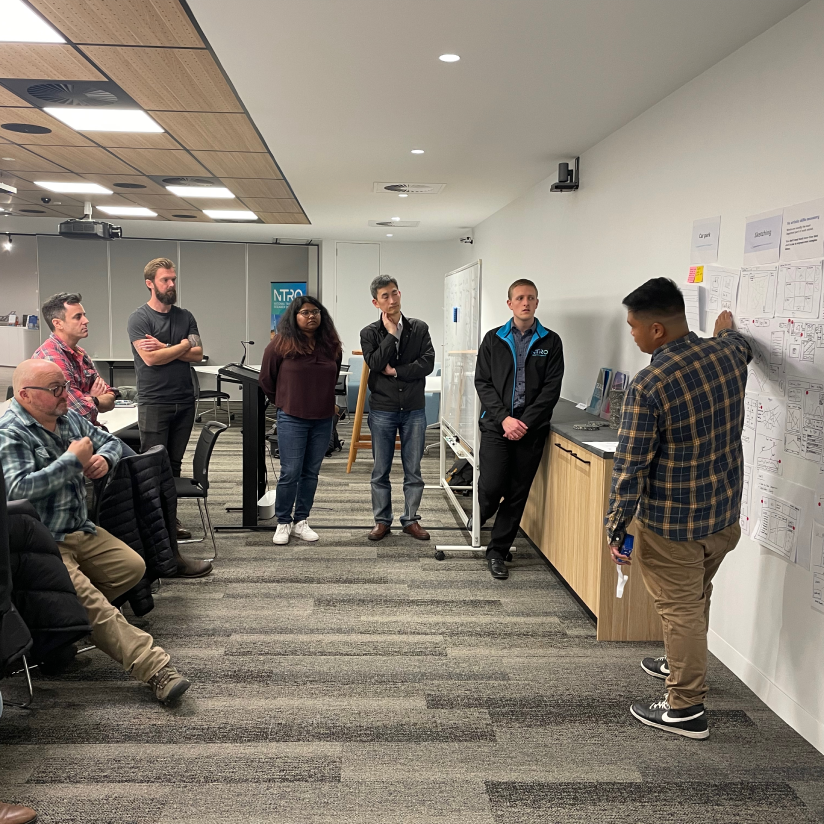
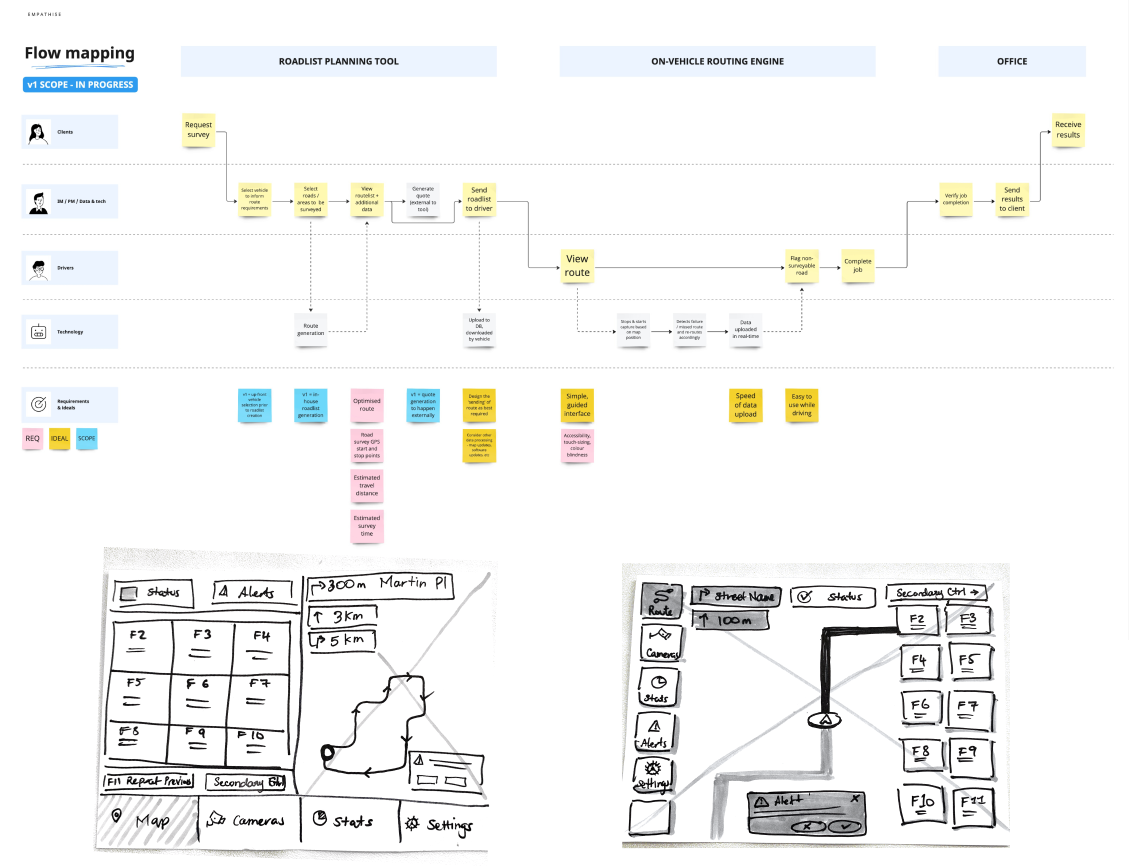
I facilitated workshops with internal teams to map user needs, pain points, and workflows, then went deeper with user interviews across all three audiences.
- Planners wanted tools to create routes efficiently and avoid manual errors.
- Drivers needed a simple, tablet-friendly app to follow routes and capture data with minimal distraction.
- Internal staff and customers required a clear dashboard for viewing and analysing survey results.
Ideation & user flows
Insights from workshops and interviews shaped solutions for the key pain points of planners, drivers, and internal staff.
- Map user journeys: outlined workflows for planning, navigation, and reporting tools.
- Wireframing: low-fidelity prototypes to illustrate key layouts and interactions.
- Refine & iterate: incorporated stakeholder feedback to balance usability with business objectives.
Outcomes
NTRO’s Road Safety Services team works towards zero deaths and serious injuries on Australian roads. Getting accurate road data into the hands of councils and transport agencies sooner gives them earlier evidence for the maintenance and investment decisions behind that goal.
Route planning
Planning that traditionally took up to a week can now be completed in as little as six hours.
Data delivery
Field-to-client delivery dropped from as long as three months to as little as 48 hours, giving asset owners earlier evidence for investment decisions.
Per survey
Fewer duplicate or missed roads, less rework, and faster reporting delivered significant time and cost savings.
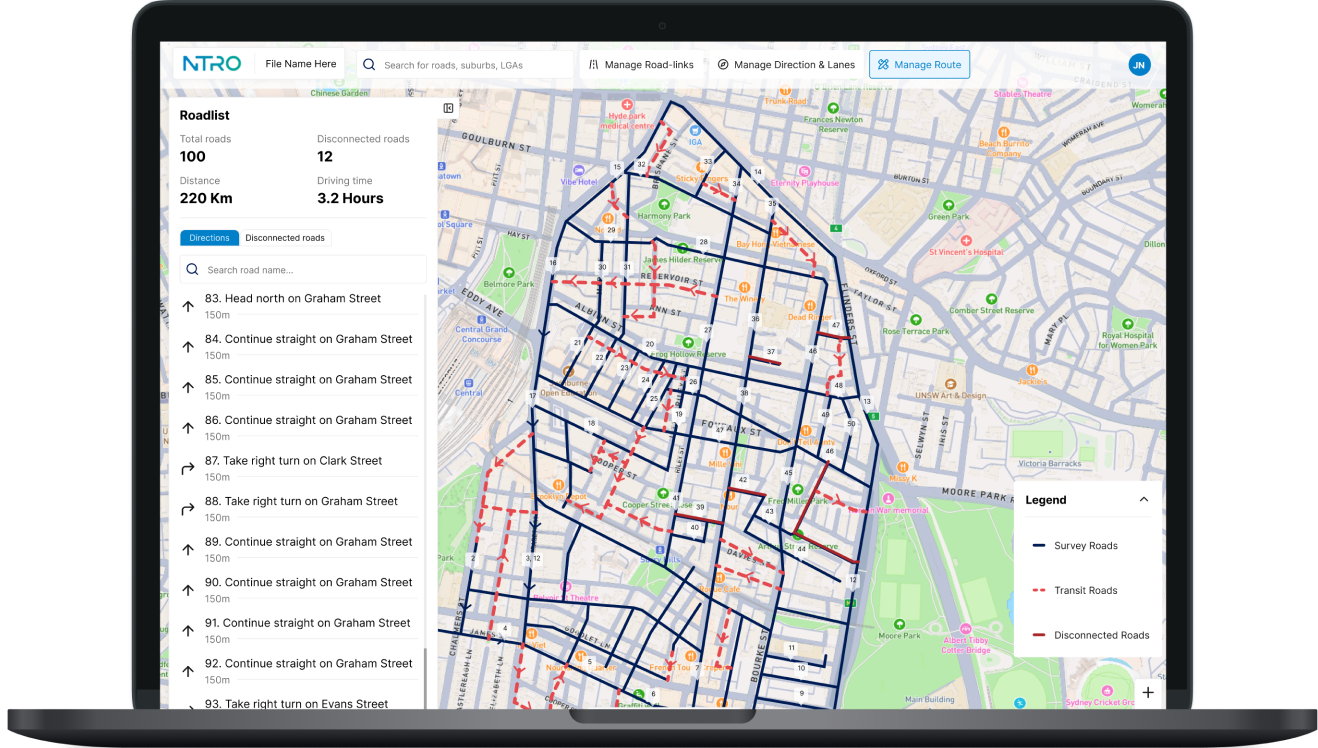
Route planner: weeks of work in an afternoon
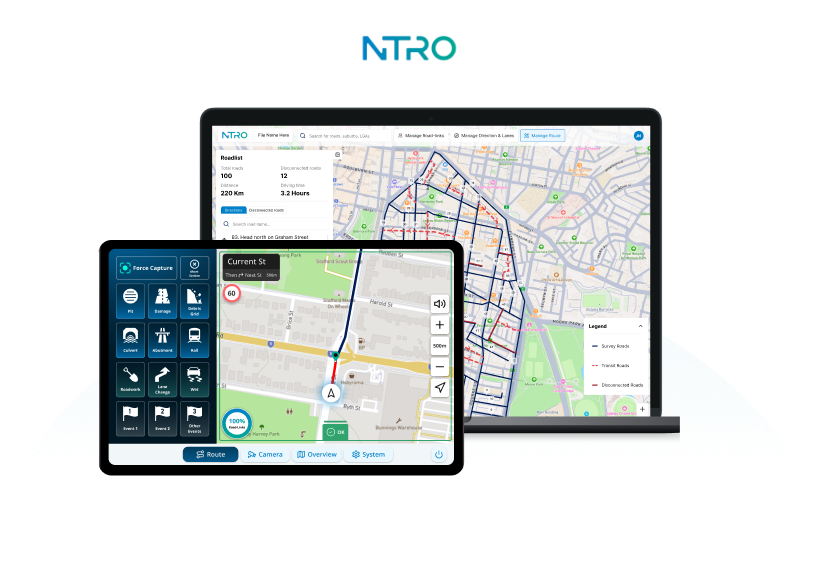
- Interactive map tools for drawing and editing survey routes.
- Improved accuracy with fewer duplicate or missed roads.
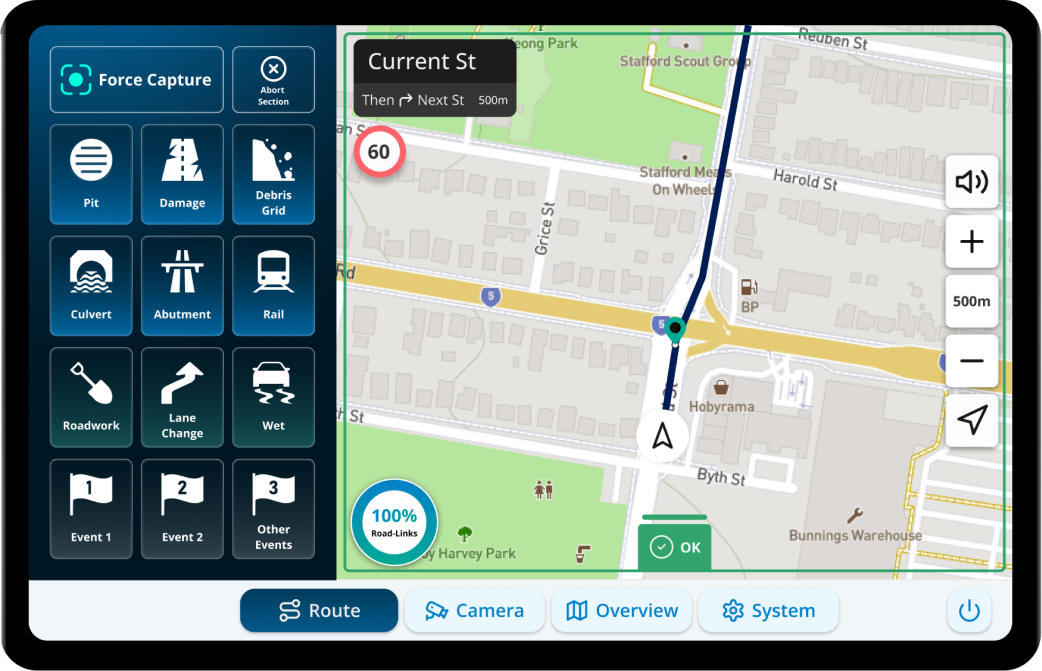
An intuitive interface for drivers and navigators
- Turn-by-turn route guidance to minimise confusion on the road.
- Automated capture modes replace manual records with data logged live as surveys happen.
- Cab-designed controls and alerts cut the amount of interaction required from crews in the field.
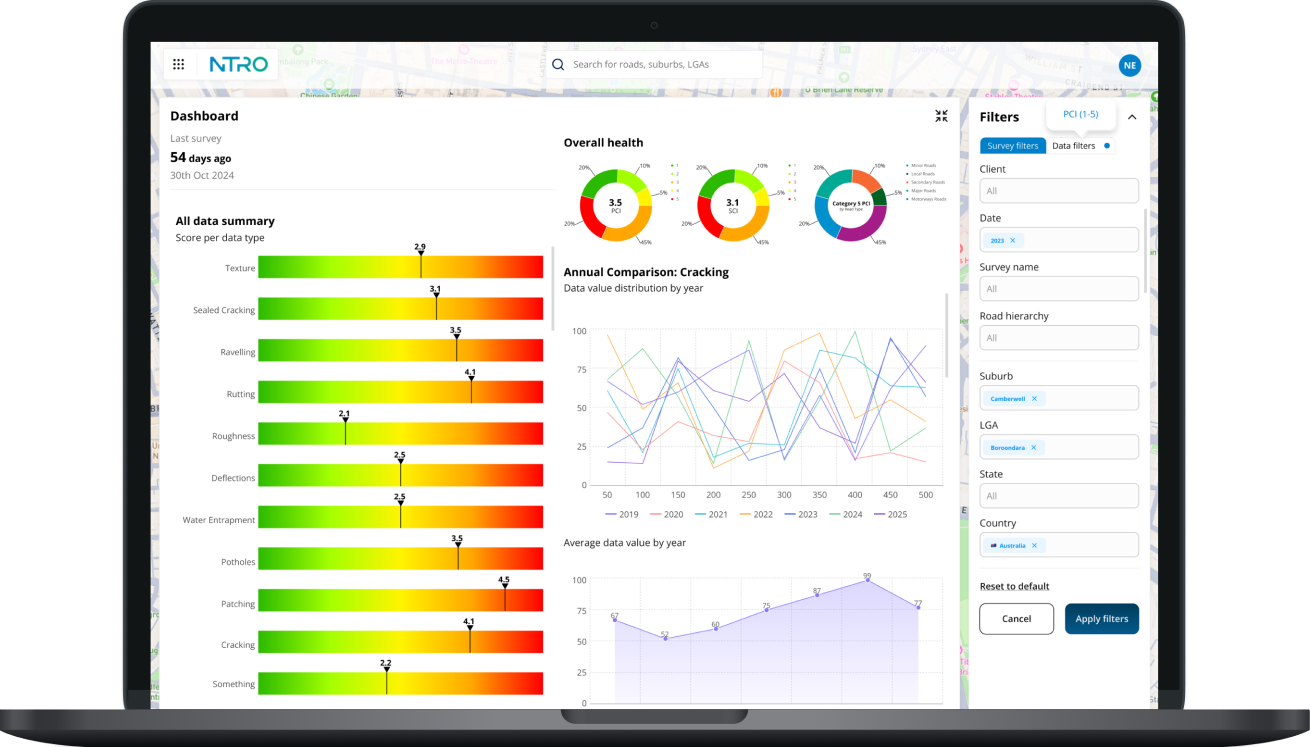
A dashboard that delivers actionable insights
- Customisable data visualisation combining maps, camera footage, road conditions, survey progress, and filters.
- Granular to high-level views of a customer’s road network transformed how insights were understood and acted on.
- Exportable reports for fast, accurate decisions, and a significant lift in customer satisfaction.